Case Studies
36 GA4 Properties, One Dashboard — Free
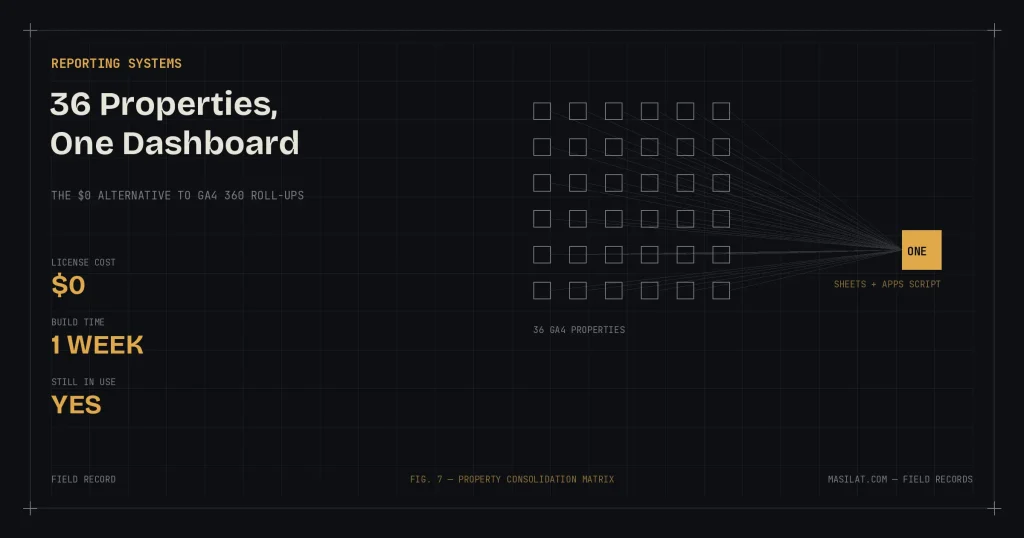
Context: International ecommerce brand, 36 regional storefronts, 36 separate GA4 properties
Constraint: Built during my final 30-day notice period.
Cost: $0
The problem
The CEO wanted one simple thing: total sessions, total orders, total revenue — across all 36 stores, in one view, broken down by channel. A completely reasonable executive request that GA4 makes surprisingly hard.
Each regional storefront had its own GA4 property. There is no free way to view them together.
What everyone tells you to do (and why it fails)
We asked everywhere — Google’s forums, Reddit, Quora, consultants, even ChatGPT. Four answers came back repeatedly:
1. “Use roll-up properties.” Correct in theory. Roll-up properties merge multiple GA4 properties into one — but they’re a GA4 360 feature. That’s the enterprise tier, priced far beyond what consolidated reporting alone can justify for most businesses.
2. “Use Looker Studio.” (Formerly Data Studio.) I tried. Looker Studio’s data blending supports five sources at a time. Five. We had thirty-six. Chaining blends into a Frankenstein report was technically conceivable and practically unmaintainable — and I had 30 days left, not 30 weeks.
3. “Just track everything into one shared property.” The cross-domain route. This solves a different problem — stitching a single user’s journey across domains — not consolidated reporting. Running a shared tag alongside the existing per-store properties would have double-counted pageviews and sessions, and a single property can only report in one currency, which is a non-starter across 36 regional storefronts. It also destroys clean per-store attribution.
4. “Buy a third-party connector.” Paid tools exist for exactly this. But that’s a recurring license plus a new vendor dependency for what is, underneath, a data-pull-and-merge job.
What I actually built
Layer 1: The free GA4 connector for Google Sheets. I set up the GA4 connector to pull each property’s data on a schedule — sessions, orders, revenue, split by channel (organic, paid, email, and the rest). One configuration tab plus 36 data tabs. 37 tabs total, refreshing automatically.
Layer 2: An Apps Script merge. Thirty-six tabs is data, not reporting. I used ChatGPT to help write a fairly extensive Apps Script that consolidates all 36 tabs into a single master sheet, preserving the channel dimension and store attribution.
Layer 3: A pivot table. On top of the master sheet: one pivot. Total sessions, orders, revenue — by channel, by store, or rolled up to the single numbers the CEO asked for. Done.
The result
- Executive reporting across 36 properties in one sheet, refreshing on schedule, at zero cost
- Built in one week, during a notice period, alongside handover work
- Still in daily use — I heard from the team recently, long after I left, that it remains their reporting backbone
The takeaway
Two lessons, one technical and one professional.
Technical: when the “correct” solution is priced for enterprises and the accessible tool has hard limits, the answer is usually composition — free connector + script + pivot beat both a five-figure license and a five-source blending cap. Knowing what tools can’t do is as valuable as knowing what they can.
Professional: the reporting system I built is the thing that outlived my employment there. How you leave is part of the work.
In markets where companies routinely revoke access on day one of a notice period, shipping something in your final 30 days says more about you than anything on your CV.